iSee Predictive Maintenance Software, coupled with the VP5, MP5 or vPod Pro data collectors, is a powerful solution to monitor and manage your machines’ health condition. With iSee Predictive Maintenance Software, you will easily build a database for managing the archive data of your machines, to prevent unscheduled shut-down and save on maintenance cost.
With iSee Predictive Maintenance Software, you can effectively monitor bearing and gear conditions, with the true peak detection of high frequency spike signals. This sophisticated condition monitoring software supports fault frequency display on spectral plots, as well as advanced band alarm analysis which can monitor specified machine health issues.
- Display fault frequencies on the vibration spectral plots for easy fault diagnosis
- Complete database of bearing fault frequencies (optional)
- Manage alarm settings by alarm category
- Effective alarm status analysis with both overall and band alarm
- Built custom report templates for simple, one click reports
- Trend plots with linked diaplay of corresponding spectral plots
- Easily setup database utilizing templates
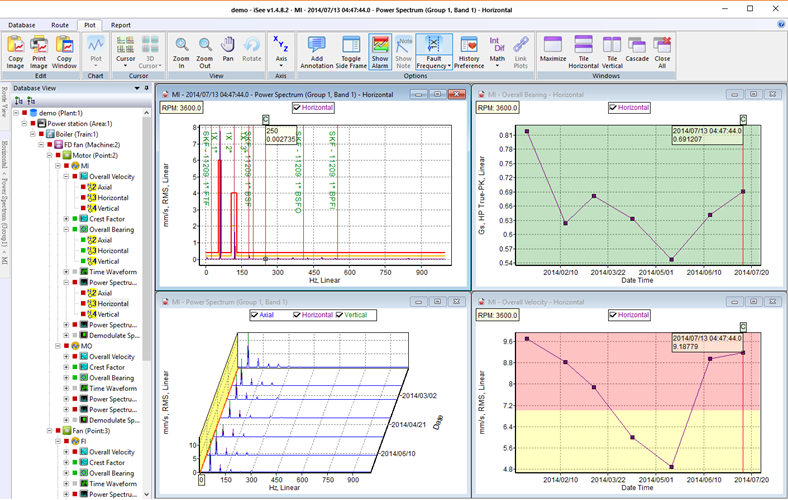
Database Mode
In Database Mode, you can:
- Create a database for the machines you are going to monitor
- Set up the monitored parameters for each point
- Map route-based data collection plans for use in the field
- Define the alarm status, fault frequency tables, and more
Monitored parameters: For each monitored point, iSee Predictive Maintenance Software allows you to select the desired vibration parameters and functions including: bearing condition values, various overall values, time waveforms, envelope spectrums, cepstrum, and up to 6 independent power spectrums.
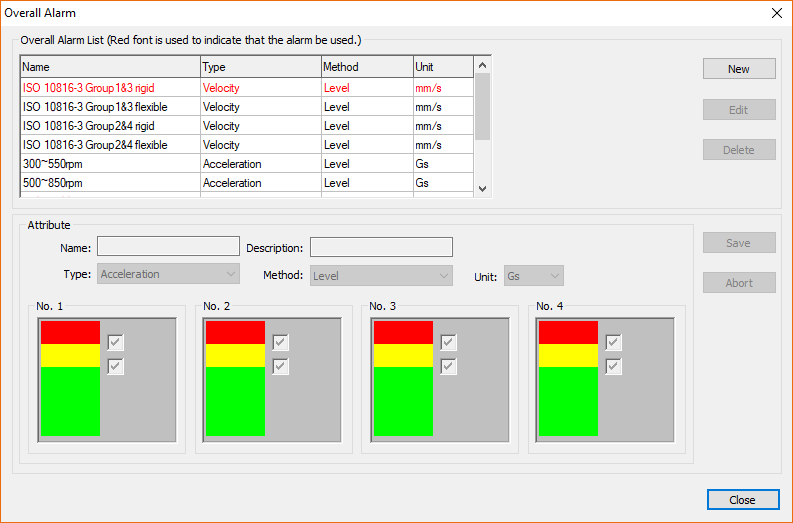
Alarm setup and management: To create a machine health alarm setting, first create the setting for the “alarm category.” This function is easily copied to similar machines saving key-in time and reducing input errors. To change the alarm level, select the category level and all associated points will be updated, saving time.
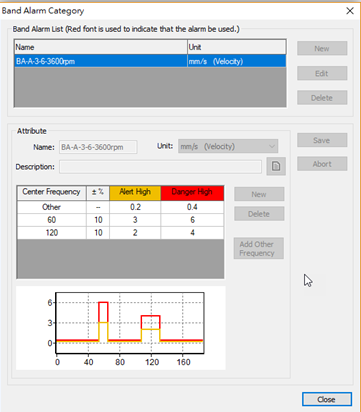
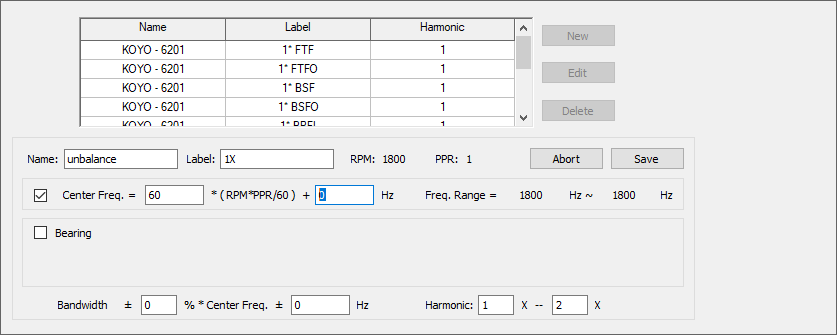
Fault frequency table: Create pre-defined gear and bearing failure frequencies from a database or user-entered parameters such as multiples of the rotation frequency, inner race, outer race frequencies of bearings and more. The display of fault frequencies on spectral plot makes your vibration analysis convenient and simple.
Route Mode
In Route Mode, you can:
- Create routes from selected nodes of the database
- Download routes to a data collector for measuring parameters in the field
- Upload the archive data back to the database for further analysis
Plot Mode
In Plot Mode, you can:
- Diagnose and analyze machine health root causes
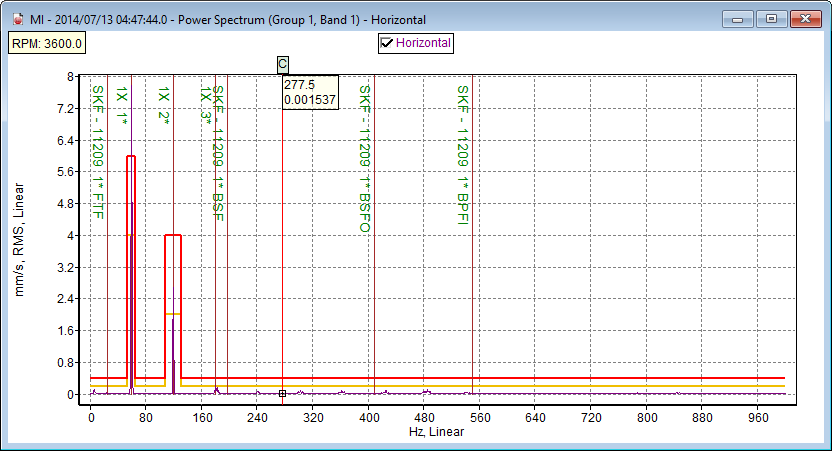
- View live or historical spectral and time waveform plots
- Synchronize your cursor across multiple spectral or time waveform plots to easily view trend data
- Enable alarm levels, fault frequencies and other diagnostic functions with a simple click of an icon, and more.
Report Mode
In Report Mode, you can:
- Use the built-in report setup wizard
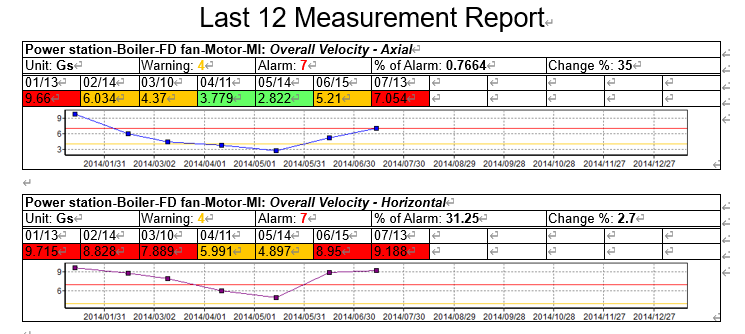
- Generate custom machine health reports with selected formats and custom optons
